A review of the past: PGMA vs Pnoy
Philippine president Benigno “Noynoy” Aquino III is known for blaming the previous administration led by former President Gloria Macapagal Arroyo for all the mistakes and mishaps which occurred during his six-year term, hence the reference to PGMA vs Pnoy.
However, it was during his term when most Filipinos, whom PNoy considers as his “boss”are inevitably shouting and questioning “Nasaan ang Pangulo?”

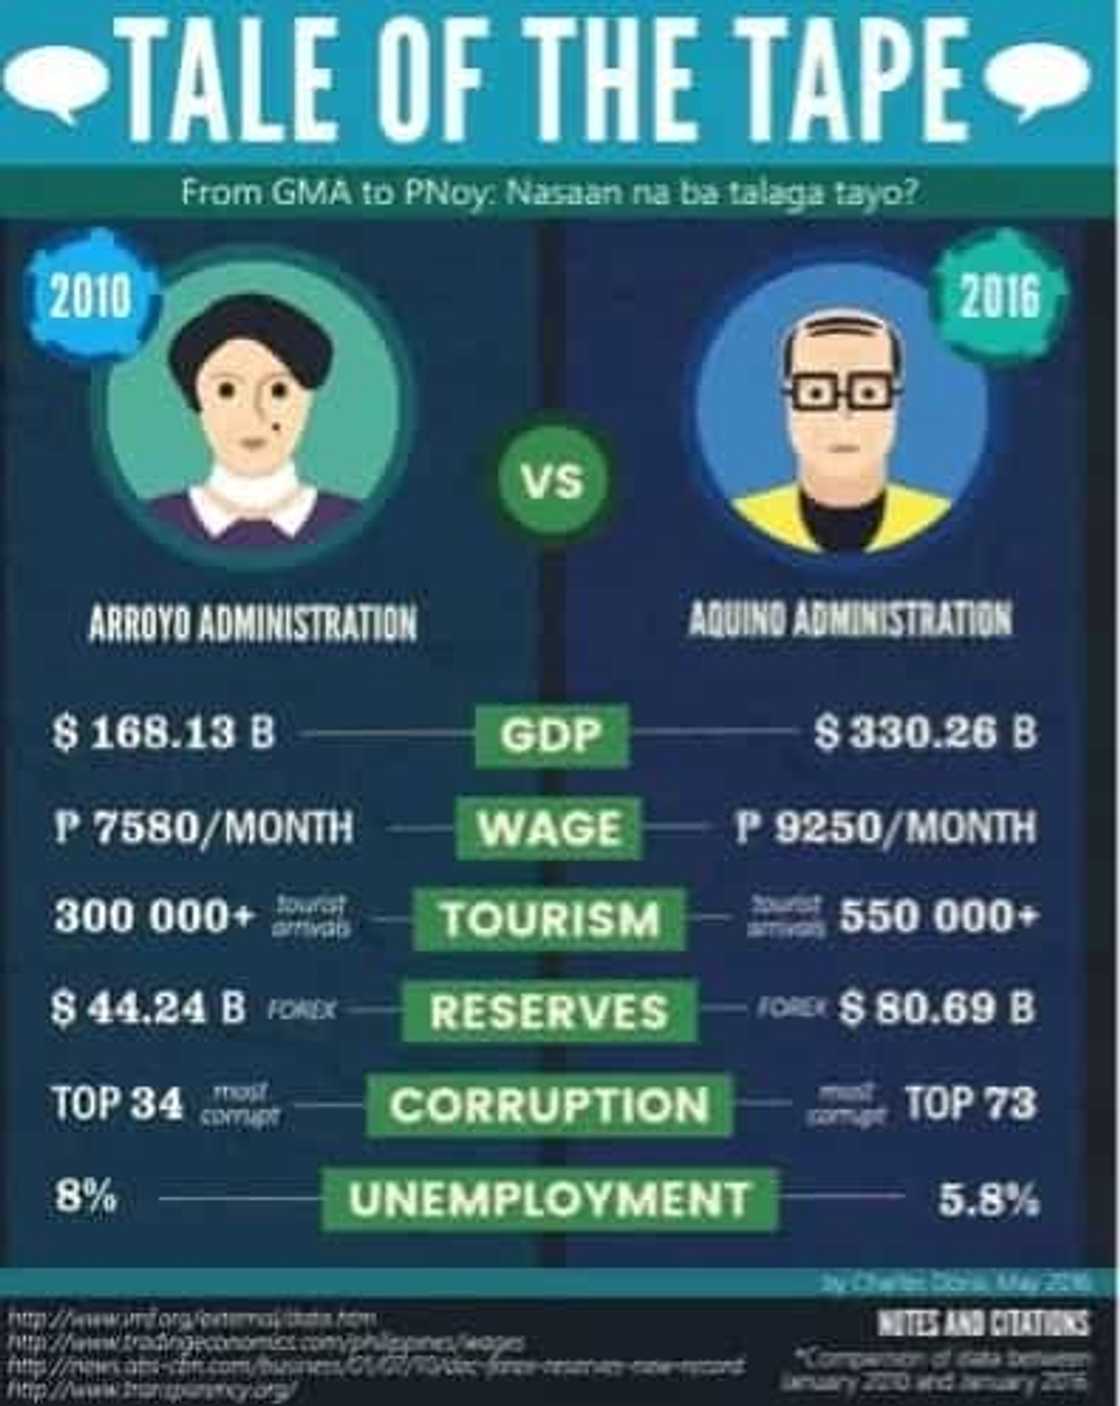
Let us answer the question “From PGMA to PNoy: Nasaan na ba talaga tayo?”
Issa Noguera Tuano, a Facebook user, helps us answer the question.
GDP

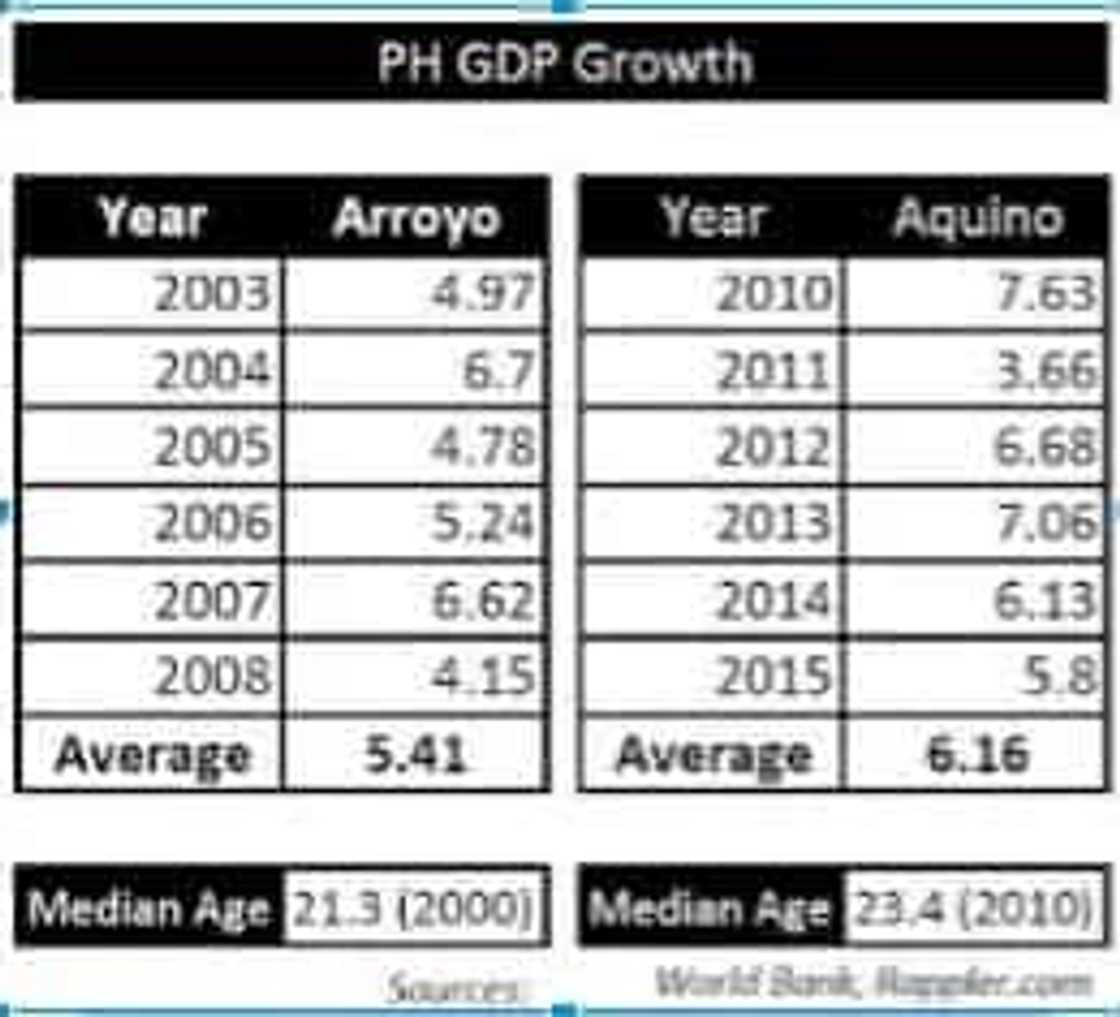
President Gloria Macapagal Arroyo is an economist. Hence, the economic growth in her six year term was a stellar 6.7 percent. It was reached notwithstanding the worst global recession in 2008 and 2009 where the growth rate understandably decreased to 4.2 percent and to 1.1 percent respectively.
President Benigno Aquino, on the other hand, never faced a recession. Outgoing Economic Planning Secretary Arsenio Balisacan says the 6.2-percent average economic growth during Aquino’s first full five years is the highest in the past 40 years.
Arroyo started in good. Aquino made it great.
Wage
It was during President Arroyo’s time when the minimum monthly wage was pegged at 7,580. Meanwhile, the present minimum monthly wage is 9,250.
According to Ibon Foundation, an independent research group, the minimum wage increases that occurred during his office were the smallest, though it increased 5 times from June 30, 2010 to May 2, 2016.
Ibon claimed that the daily minimum wage in the National Capital Region (NCR or Metro Manila) correspondingly rose from P404 in July 2010 to P481 today, or an increase of only P77.00, the smallest since the time of his mother, President Corazon “Cory” Aquino.
A big frown for PNoy for failing the Filipino workers.
Tourism
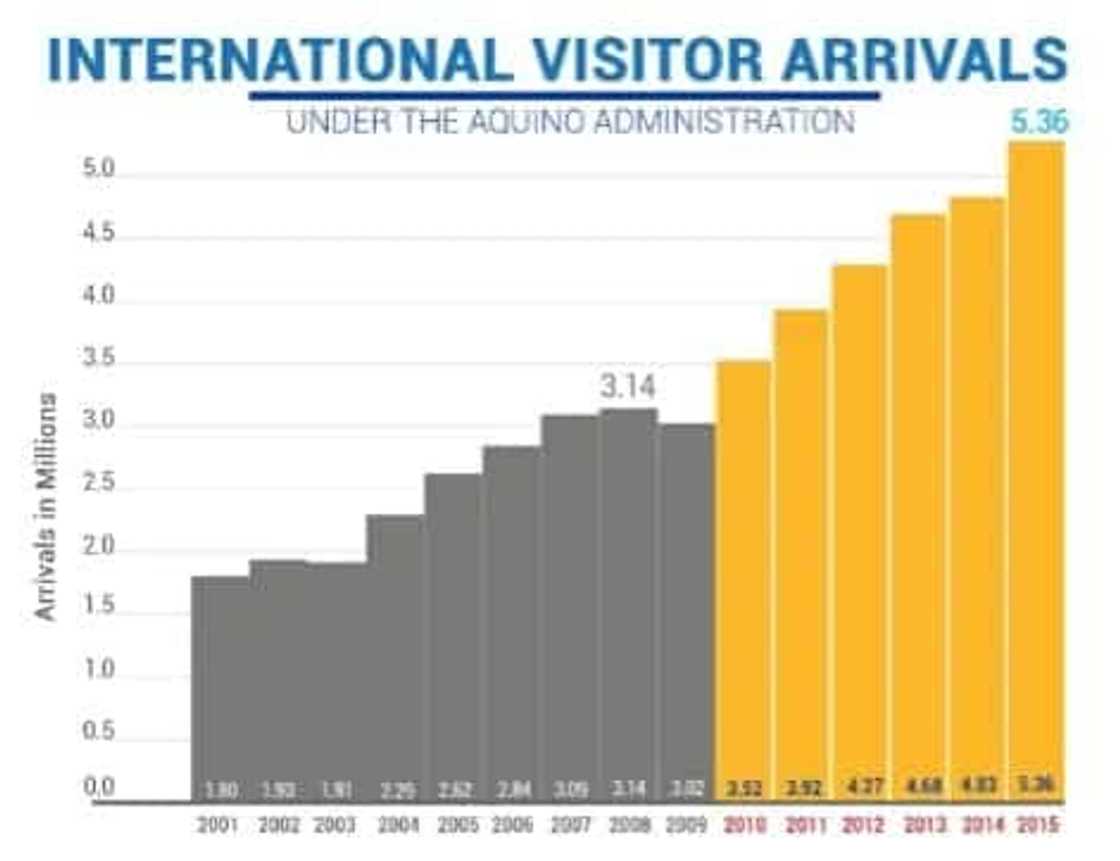
According to the Official Gazette, international tourist arrivals posted a compounded annual growth rate (CAGR) of 8.77% from 2010 to 2015 (PNoy’s term), higher than the 7.76% CAGR achieved in the nine years from 2001 to 2010 (PGMA’s term). International tourist receipts also showed a dramatic increase from P112.55 in 2010 to P227.62B in 2015.
The tourism industry marked another milestone because for the first time in history, total inbound tourists went beyond five million. In 2015, Philippines is welcoming 5,360,682 visitors.
“At the rate that the industry is growing, tourism has proven that it is an important pillar in the country’s economic growth. More than the industry’s performance in terms of numbers, tourism has proven to be a successful means to spread the growth of the country to various sectors, from the protection of the environment to the emergence of local businesses, the development of infrastructure, and the preservation of our cultural heritage,” Tourism Secretary Ramon R. Jimenez said.
Both presidents deserve a hand!

Reserves
According to the statistics released by the Bangko Sentral ng Pilipinas (BSP), the country’s official reserve assets as of end-July 2010 stood at approximately US$49.04 billion, posting a 22.09 percent increase from its end-July 2009 level of US$40.17 billion.
Cheers to PNoy as it is during his time where our country's foreign exchange reserves hit their highest level in more than two years, said the Bangko Sentral ng Pilipinas (BSP).
In April, gross international reserves (GIR) reached $83.47 billion, almost double the 2010 reserve assets.
The GIR is the sum of all foreign exchange flowing into the country. These reserves function as protection to guarantee that the country does not run out of foreign exchange used to pay for imported goods and services or foreign currency debt.
Corruption
The Philippines has been topping world’s nastiest surveys – worst airport, worst country to die in, worst crime rate. One does not wonder why we do not belong in the list of most corrupt countries.
The Philippines landed at top 34 during PGMA’s administration. In PNoy’s time, we got a farther ranking – 73rd.
No administration is to be praised here. Corruption should be completely eradicated.
Unemployment
The unemployment rate in our country measures the number of people actively looking for a job as a percentage of the labor force.
During PGMA’s time, the Philippine Statistics authority announced that the “annual employment rate or the percentage of the labor force who were employed in 2010 was 92.7 percent. This rate was calculated using the average estimates of employed persons and persons in the labor force from the four rounds of the quarterly Labor Force Survey (LFS) conducted in 2010. Last year's employment rate was 92.5 percent.
Among regions, Cagayan Valley, Zamboanga Peninsula and Autonomous Region in Muslim Mindanao (ARMM) posted employment rates of more than 96 percent. The National Capital Region (NCR) registered the lowest employment rate of 88.5 percent.
Of the estimated 36.0 million employed persons in 2010, more than half (51.8%) were engaged in services and about one-third (33.2%) were in agriculture. Most of those who worked in the services sector were into wholesale and retail trade, repair of motor vehicles, motorcycles and personal and household goods (19.5% of the total employed).
Of the total employed persons, the laborers and unskilled workers comprised the largest group (32.3%). This was followed by farmers, forestry workers and fishermen (16.0%); officials of government and special interest organizations, corporate executives, managers, managing proprietors and supervisors (13.8%); and service workers, shop and market sales workers (10.6%). The rest of the major occupation groups each comprised less than 10 percent ranging from 0.4 percent to 7.7 percent.
The majority (54.4%) of the employed were wage and salary workers, most of whom were in private establishments (40.4% of the total employed). Thirty percent were self-employed without any paid employee, four percent were employer in own family-operated business or farm while nearly 12 percent worked without pay in own family-operated farm or business.
More than half (63.5%) of the total employed were full time workers or have worked for at least 40 hours per week. On the average, employed persons worked 41.7 hours a week in 2010.
The number of underemployed workers in 2010 was 6.8 million, representing an annual underemployment rate of 18.7 percent. Underemployed workers are persons who express the desire to have additional hours of work in the present job, or to have an additional job, or to have a new job with longer working hours. The lowest underemployment rate was observed in Central Luzon (9.1%) while the highest was noted in Bicol Region (36.8%).
About 2.9 million Filipinos were unemployed in 2010 representing an unemployment rate of 7.3 percent for the year. The unemployed persons who have attained high school accounted for 45.2 percent of all unemployed. The proportion of unemployed males was greater than that of their female counterparts (63.3% compared to 36.7%).
The labor force population or those who are either employed or unemployed reached 38.9 million resulting to an annual labor force participation rate (LFPR) of 64.1 percent. Among regions, Northern Mindanao had the highest annual LFPR of 69.8 percent.”
During PNoy’s term, the PSA stated that “the employment rate in January 2016 was estimated at 94.2 percent. Three regions, namely, Central Luzon (92.5%), CALABARZON (92.5%), and National Capital Region (NCR) (93.1%) had employment rates significantly lower than the national figure (Table 4). The labor force participation rate (LFPR) in July 2016 was estimated at 63.3 percent. The labor force population consists of the employed and the unemployed 15 years old and over.
Workers were grouped into three broad sectors, namely, agriculture, industry and services sector. Workers in the services sector comprised the largest proportion of the population who are employed. These workers made up 56.3 percent of the total employed in January 2016. Among them, those engaged in wholesale and retail trade or in the repair of motor vehicles and motorcycles accounted for the largest percentage (33.5%) of workers in the services sector.
Workers in the agriculture sector comprised the second largest group making up 27.0 percent of the total employed in January 2016, while workers in the industry sector made up the smallest group registering 16.7 percent of the total employed. The January 2016 LFS results also showed that in the industry sector, workers in the manufacturing subsector made up the largest group, accounting for 49.2 percent of workers in this sector, and those in construction, the second largest group, making up 45.4 percent.
Among the occupation groups, the laborers and unskilled workers remained the largest group making up 31.7 percent of the total employed in January 2016. Officials of the Government and special interest organizations, corporate executives, managers, and managing proprietors (16.8% of the total employed) comprised the second largest occupation group, followed by service workers and shop/market sales workers (13.0%), and farmers, forestry workers and fishermen (11.5%).
Employed persons fall into any of these categories: (1) wage and salary workers, (2) self-employed workers without any paid employee, (3) employers in own family-operated farm or business, and (4) unpaid family workers. Wage and salary workers are those who work for private households, private establishments, government or government-controlled corporations, and those who work with pay in own family-operated farm or business. In January 2016, the wage and salary workers made up 63.2 percent of the total employed, with those working in private establishments continuing to account for the largest percentage (Table 1). They made up 48.5 percent of the total employed in January 2016. The second largest class of workers were the self-employed making up 25.8 percent of the total employed in January 2016. Unpaid family workers accounted for 7.7 percent of the total employed.
Employed persons are classified as either full-time workers or part-time workers. Full-time workers refer to those who worked for 40 hours or more during the reference week, while those who worked for less than 40 hours were considered part-time workers. Of the total employed persons in January 2016, 67.3 percent were full-time workers, while 32.0 percent were part-time workers. In this round of LFS, workers worked 42.5 hours per week, on the average.
By definition, employed persons who express the desire to have additional hours of work in their present job, or to have additional job, or to have a new job with longer working hours are considered underemployed. In January 2016, the underemployment rate, which is the percentage of the underemployed to the total employed, was estimated at 19.7 percent.
Underemployed persons who work for less than 40 hours in a week are called visibly underemployed persons. They accounted for 51.4 percent of the total underemployed in January 2016. By comparison, the underemployed persons who worked for 40 hours or more in a week made up 47.5 percent. By sector, 44.8 percent of the underemployed worked in the services sector, while 37.2 percent were in the agriculture sector. Those in the industry sector accounted for 18.0 percent.
The unemployment rate in January 2016 was estimated at 5.8 percent.
Among the regions, Central Luzon (7.5%), CALABARZON (7.5%), and NCR (6.9%) had unemployment rates significantly higher than the national figure.
Among the unemployed persons in January 2016, 63.4 percent were males. Of the total unemployed, the age group 15 to 24 years comprised 48.2 percent, while the age group 25 to 34, 30.9 percent. By educational attainment, 19.7 percent of the unemployed were college graduates, 14.5 percent were college undergraduates, and 32.9 percent were high school graduates.
RELATED: Top 10 Pnoy's promises, kept and broken
Source: KAMI.com.gh

